November STAT with October’s Data
COMMENTARY by ARMLS Staff
A Tale of Two Markets
October’s housing market is showing different trends across price ranges. Overall sales activity has slowed; closings on homes priced below $500,000 declined 14.5% from a year ago, while homes selling above $2 million accounted for a slightly larger share of the market than previous months.
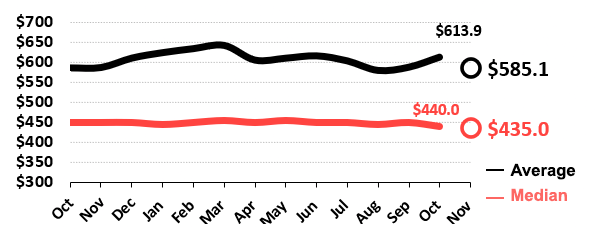
These differences are reflected in October’s pricing statistics. The average sales price climbed to $613,903, up 4.7% from a year ago and back above $600,000. The median sales price, however, declined 2.2% to $440,000.
Two Numbers. Two Different Stories.
- Average Sales Price: $613,903 | Up 4.7% year over year
- Median Sales Price: $440,000 | Down 2.2% year over year
Why the difference? Average sales price is influenced by every transaction, making it more sensitive to higher-priced sales. Median sales price represents the middle transaction, with half of homes selling above and half below. A shift in the mix of homes selling can push the average higher even when the median is declining.
The broader market continues to slow.
Active inventory reached 27,980 in October, up 9.6% from a year ago, while new listings declined 3.9% and closed sales fell 17.2%. Contracts (pending, UCB and CCBS combined) were down 19.7%. Months of supply increased to 6.04, compared to 4.72 a year ago and 5.03 in September.
Mortgage rates may also be contributing to the slowdown. The 30-year fixed mortgage rate averaged 7.33% in October, compared to 6.25% a year ago, its highest average level in three years.
The takeaway: The market isn’t moving in one direction across all price ranges. Looking beyond the average sales price reveals a more nuanced picture of what’s happening across the state.